This website allows you to view electoral and socio-economic data compiled for the book A History of Political Conflict in three different ways.
First, at the national level: map the distribution of votes and wealth in France since 1789.
Then, for each of the 36,000 municipalities: explore the evolution of votes and socio-economic characteristics (income, real estate capital, education, professions, etc.).
Finally, for all elections and political trends: find out which municipality has the most popular and most bourgeois vote.
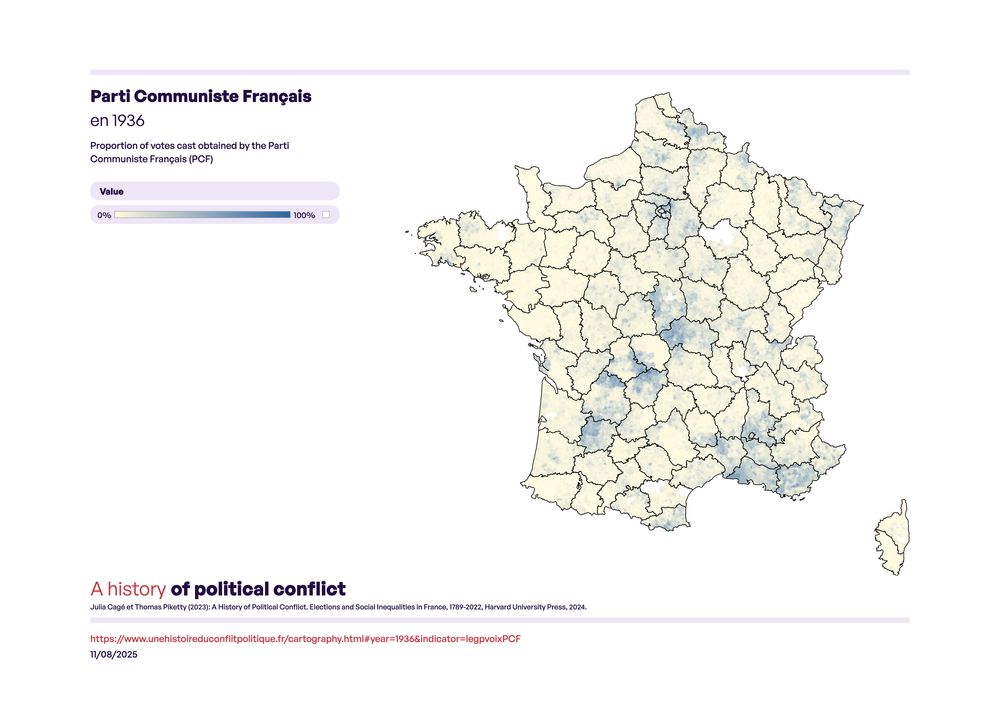
In the 1936 legislative elections, candidates backed by the PCF won 15% of the vote in the first round, with large variations between municipalities, which you can see by zooming in on the map. In the Paris region, for example, the PCF won 70% of the vote in Bobigny (Seine-Saint-Denis), compared with 8% in Marnes-la-Coquette (Hauts-de-Seine). The PCF also performed very strongly in some rural areas, for example winning 75% of the vote in Saint-Victor (Allier). It was generally weak in the west of the country, winning only 1% of the vote in Carnac (Morbihan), but as much as 51% in Concarneau (Finistère).
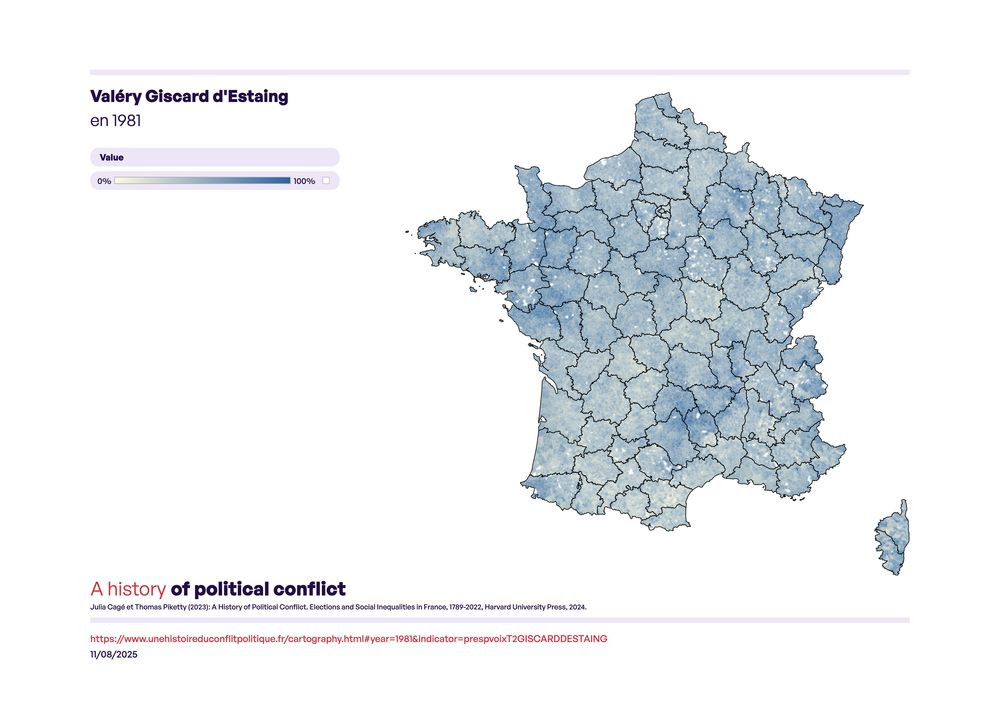
In the 1981 presidential elections, Valéry Giscard d'Estaing lost to François Mitterrand in the second round with 48% of the vote against 52%. Zooming in on the map, you can see large variations between municipalities. For example, Giscard won 77% of the vote in the 16th arrondissement of Paris and 66% in Saint-Jean-Cap-Ferrat (Alpes-Maritimes), but only 28% in Villetaneuse (Seine-Saint-Denis) and Berre-l'Étang (Bouches-du-Rhône).
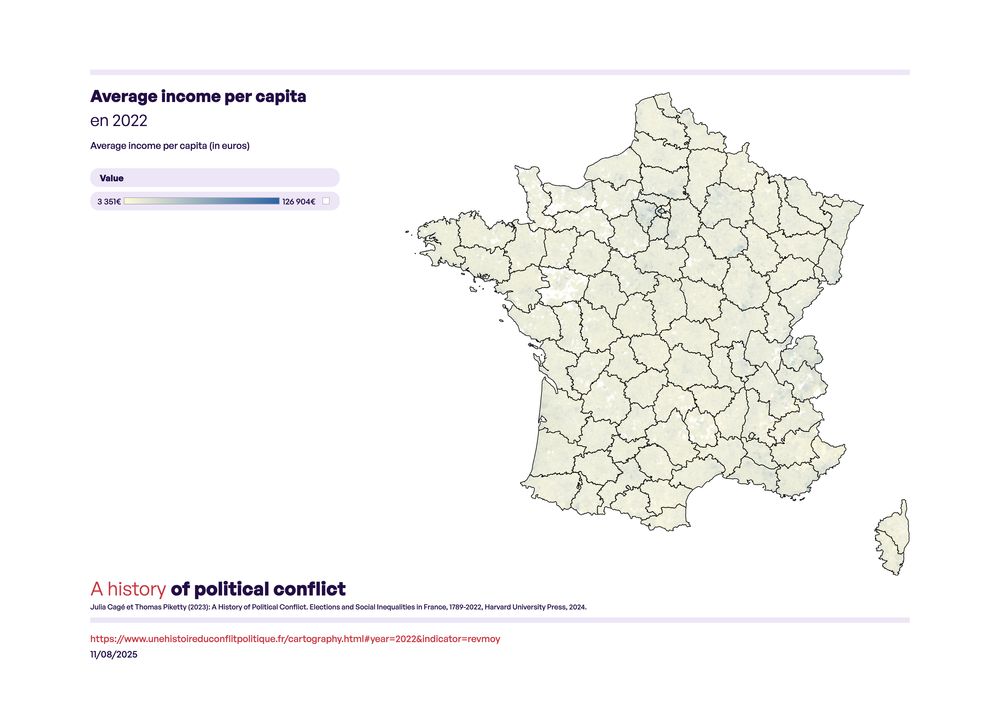
In 2022, the average annual income per capita, defined as the total income reported on tax returns (before any allowances or deductions) divided by the total number of inhabitants (including children), is 19,200 euros. Zooming in on the map, you will see that this average is only 8,900 euros in Roubaix (Nord), reaching 60,700 euros in Le Touquet (Pas-de-Calais) and 107,600 euros in the 7th arrondissement of Paris. Thanks to the data we have collected on income and housing values since the nineteenth century, we can study the evolution of inequality over time and analyze its impact on electoral behaviors.
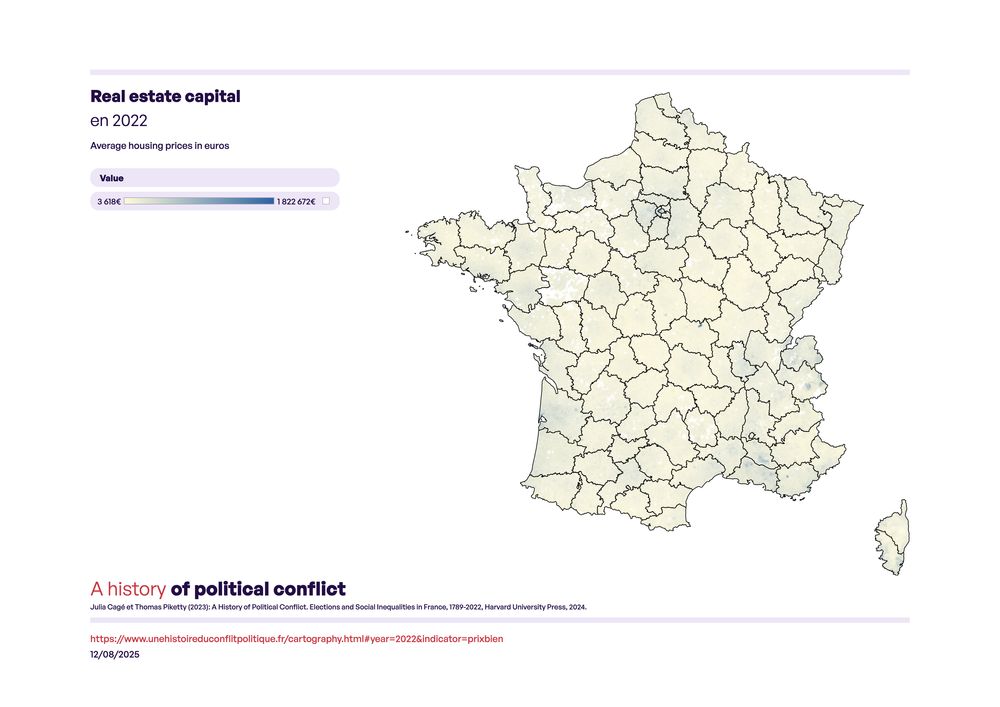
In 2022, the average real estate capital, defined as the average value of housing observed in real estate transactions, is 219,500 euros. Zooming in on the map, you will see that this average is only 65,400 euros in Vierzon (Cher), reaching 819,300 euros in Saint-Marc-Jaumegarde (Bouches-du-Rhône) and 1,268,500 euros in the 7th arrondissement of Paris. Thanks to the data we have collected since the nineteenth century, we can study the evolution of inequality over a long period and analyze its impact on electoral behaviors.
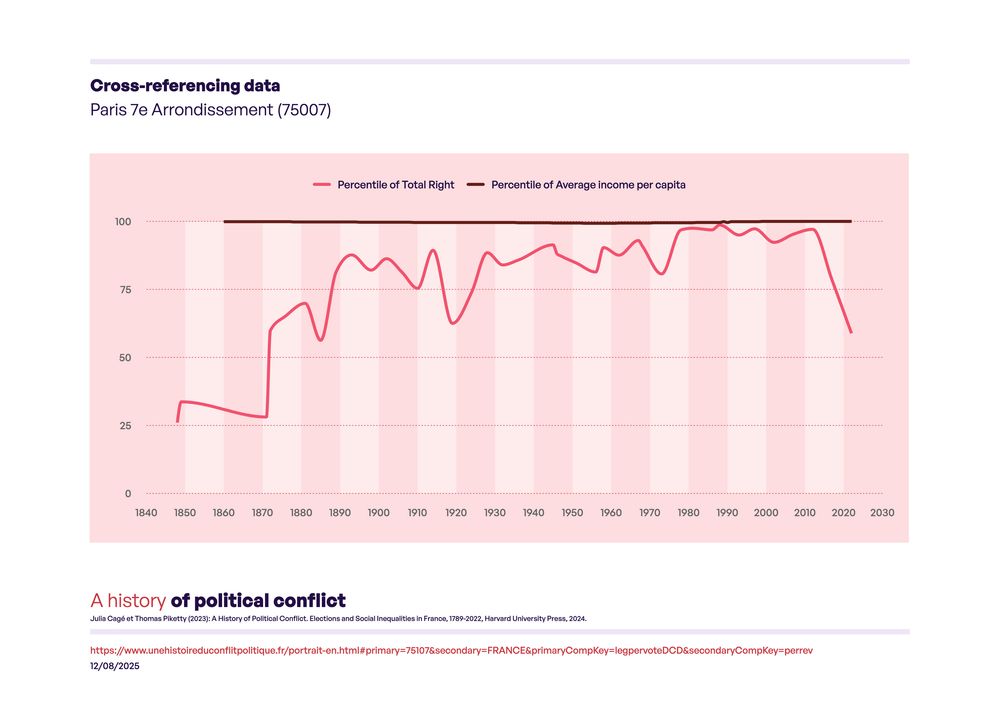
Throughout the twentieth century, Paris’s 7th arrondissement generally ranked between the 90th and 100th percentile in terms of right-wing voting (in other words, it was almost always among the 10% of municipalities that voted most to the right) and between the 99th and 100th percentile in terms of income distribution (in other words, it has almost always been among the richest 1% or 2% of municipalities). However, in 2017 and 2022, there was a drop in the 7th arrondissement’s share of the right-wing vote, which can be explained by its shift towards the center bloc.
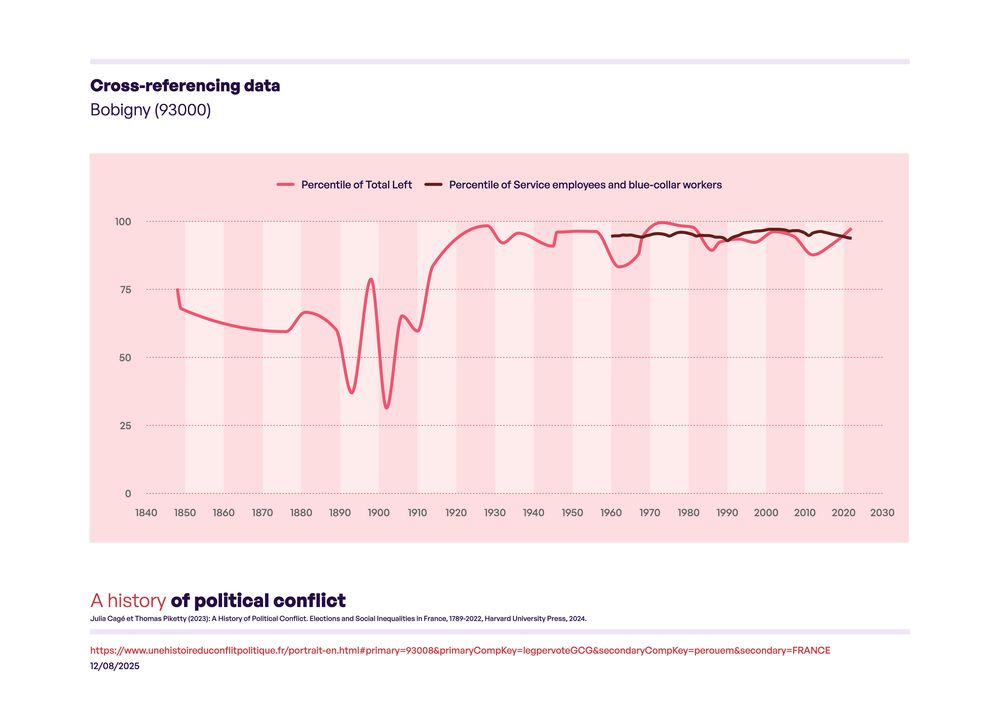
Throughout the twentieth century and the first decades of the twenty-first century, the commune of Bobigny (Seine-Saint-Denis) generally ranked between the 90th and 100th percentile in terms of the distribution of votes for the Left (in other words, it has almost always been among the 10% of municipalities voting most to the left), and between the 90th and 100th percentile in the distribution of the proportion of blue-collar workers and service employees (in other words, it has almost always been among the 10% of municipalities with the highest proportion of blue-collar workers and service employees).
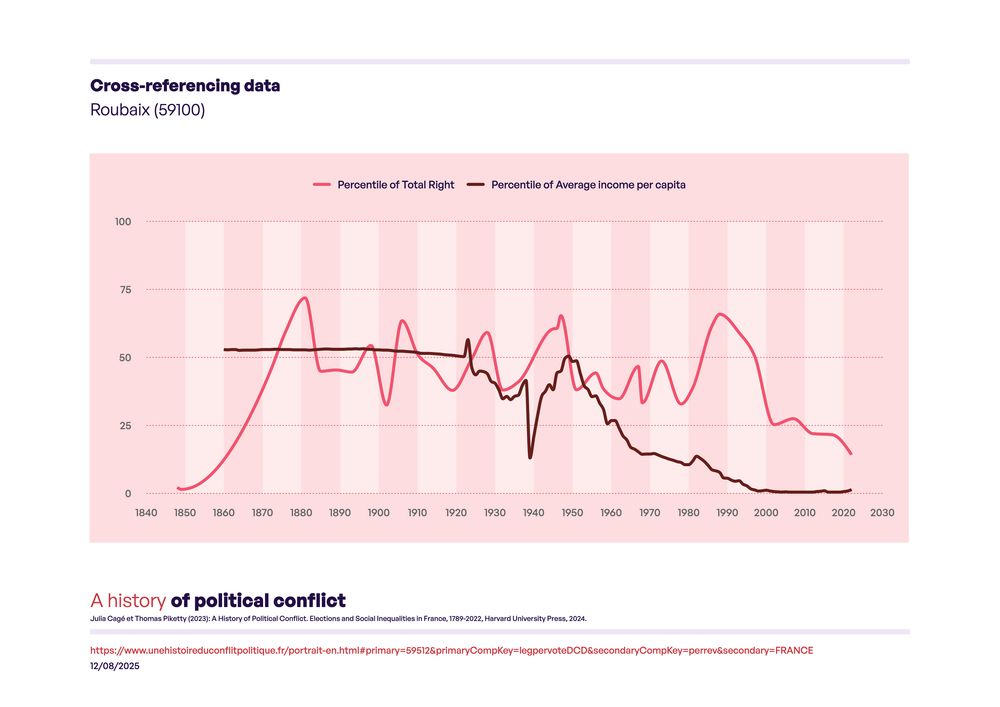
Roubaix’s position in terms of average municipal income has collapsed over the last few decades: the municipality was among the poorest 25% of municipalities in the early 1960s and is now among the poorest 1% in the early 2020s. The municipality’s vote has varied over time but has generally been left-wing, with a peak on the right in the 1980s and 1990s (FN vote) and then a clear return to the left since 2000-2010.
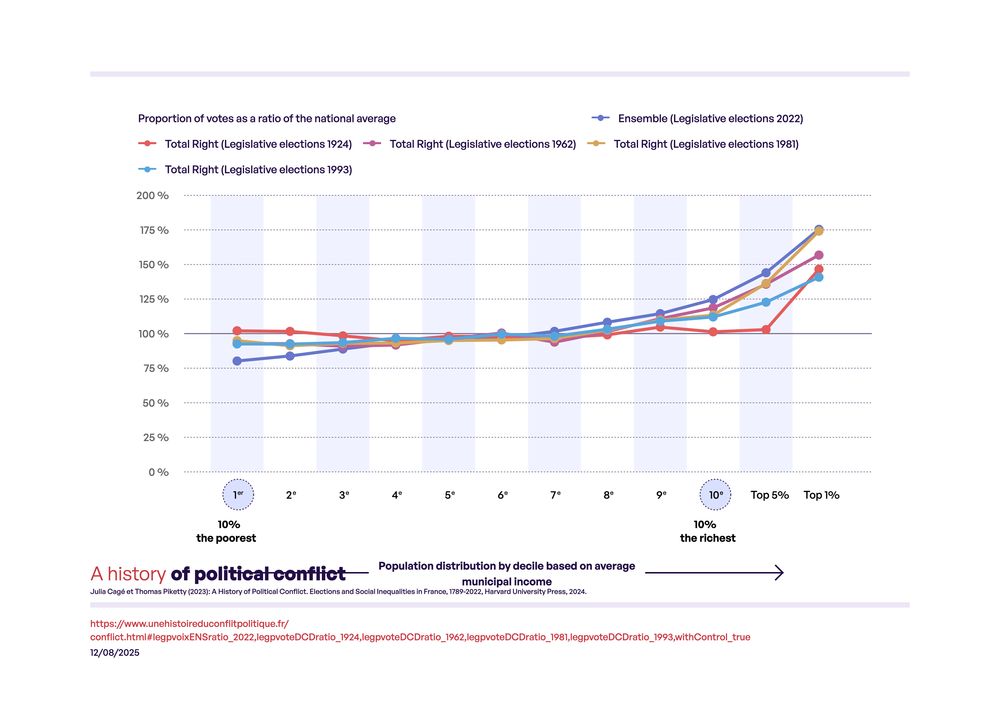
In the second round of the 1981 presidential election, Valéry Giscard d’Estaing achieved a much higher score than his national average among the 30% of the population living in the richest municipalities (up to 1.62 times his national average score among the 1% of the population living in the richest municipalities), and a lower score than his national average among the 70% of the population living in the poorest municipalities. The vote for François Mitterrand showed the exact opposite pattern.

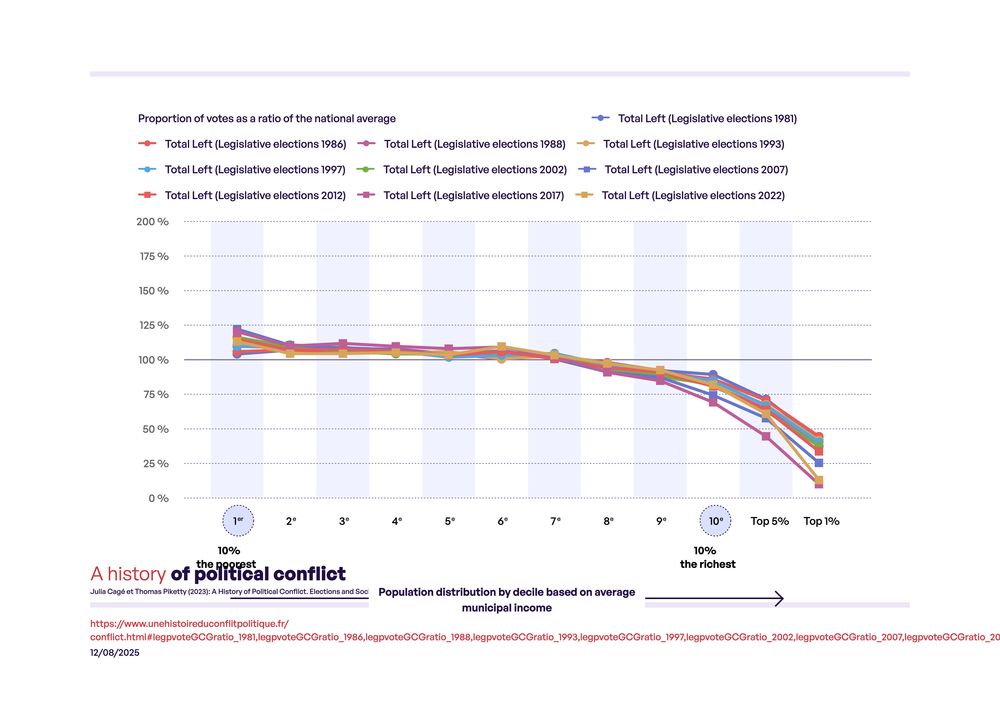
Contrary to popular belief, the voting profile for left-wing parties (Socialists, Communists, Greens, Insoumis, etc.) in the legislative elections from 1981 to 2022 has always been a function that declines sharply with average income in the municipality, particularly at the top of the distribution. The slope even tends to be steeper in 2017 and 2022 than in previous elections, which can be explained by the fact that some of the wealthiest left-wing voters have shifted to the Center bloc.
In the 2022 elections, the vote for Macron increases sharply with the wealth of the municipality, while the votes for Mélenchon and Le Pen decrease with the wealth of the municipality. The Mélenchon vote is particularly strong in poor municipalities in urban areas, and the Le Pen vote is strongest in poor municipalities in rural areas.

The vote for the Ensemble-UDI bloc in 2022 increases steeply with income. The slope is broadly comparable to that observed for right-wing votes in the past, with the difference that the latter generally scored better in the poorest municipalities (particularly in the poorest rural municipalities, but not exclusively).